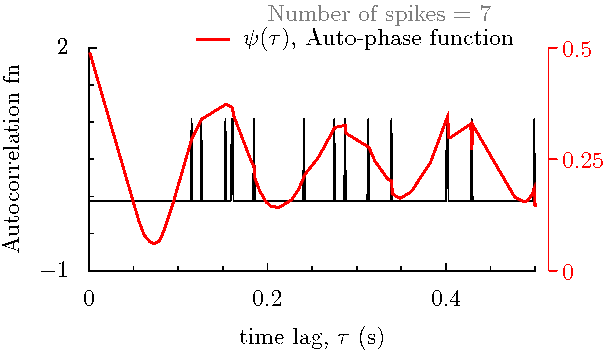
This animation compares the phase function with autocorrelation function computed
with number of data points from as few as 3 to as many as 673. The phase function
performs better than correlation function for fewer data ponits, and corresponds
well with the correlation function for large number of data points.
The data consists of discrete spike time events (given here in seconds) from in vitro recordings of rat globus pallidus neurons. Each comparison is for the selected number of data points (spike time events) shown in "Number of spikes" in the figure. The auto-correlation function is plotted in black, and the auto-phase function is plotted in red.
The data consists of discrete spike time events (given here in seconds) from in vitro recordings of rat globus pallidus neurons. Each comparison is for the selected number of data points (spike time events) shown in "Number of spikes" in the figure. The auto-correlation function is plotted in black, and the auto-phase function is plotted in red.